0DTE, Explained: Why Intraday Vanna Can Steamroll Price-Action Signals
Understand how 0DTE flows reshape intraday price action, why intraday vanna can dominate, and how to build a repeatable execution plan.
Read Article →An urgent message for every independent trader…
There's a hidden force moving every trade you make. Wall Street knows it exists. They profit from it daily. But they've never told you about it. Today, that changes.
Have you ever had this happen to you?
You spend hours on analysis. Every indicator aligns. The setup looks perfect. You place the trade with confidence.
Then the market does something impossible. Price moves against you on zero news. Your stop gets hit. And you sit there wondering: "What the hell just happened?"
Here's what happened: You got steamrolled by The Flow.
Every month, Wall Street dealers are forced to hedge $47 billion in options exposure. They don't want to do this. They don't get to choose when. The math forces their hand, and when it does, they move price like a freight train.
For three years, 2,453 patient, professional traders have learned to ride this freight train instead of standing in front of it. They stopped gambling on daily moves and started positioning for mathematical certainties.
These aren't day-traders chasing dopamine hits. These are professionals who wait for high-conviction setups that fire when the math forces Wall Street's hand.
If that sounds like your approach, read on.
Institutional-grade insights into options flow and market microstructure
Understand how 0DTE flows reshape intraday price action, why intraday vanna can dominate, and how to build a repeatable execution plan.
Read Article →How to trade CPI/FOMC weeks using options microstructure: charm decay, vol crush, vanna tailwinds, and the post-event drift. A practical, rules-based playbook.
Read Article →Learn how vanna, charm, and gamma exposure (GEX) drive dealer hedging and intraday price action—especially with 0DTE and weekly expirations. Practical checklists and playbooks inside.
Read Article →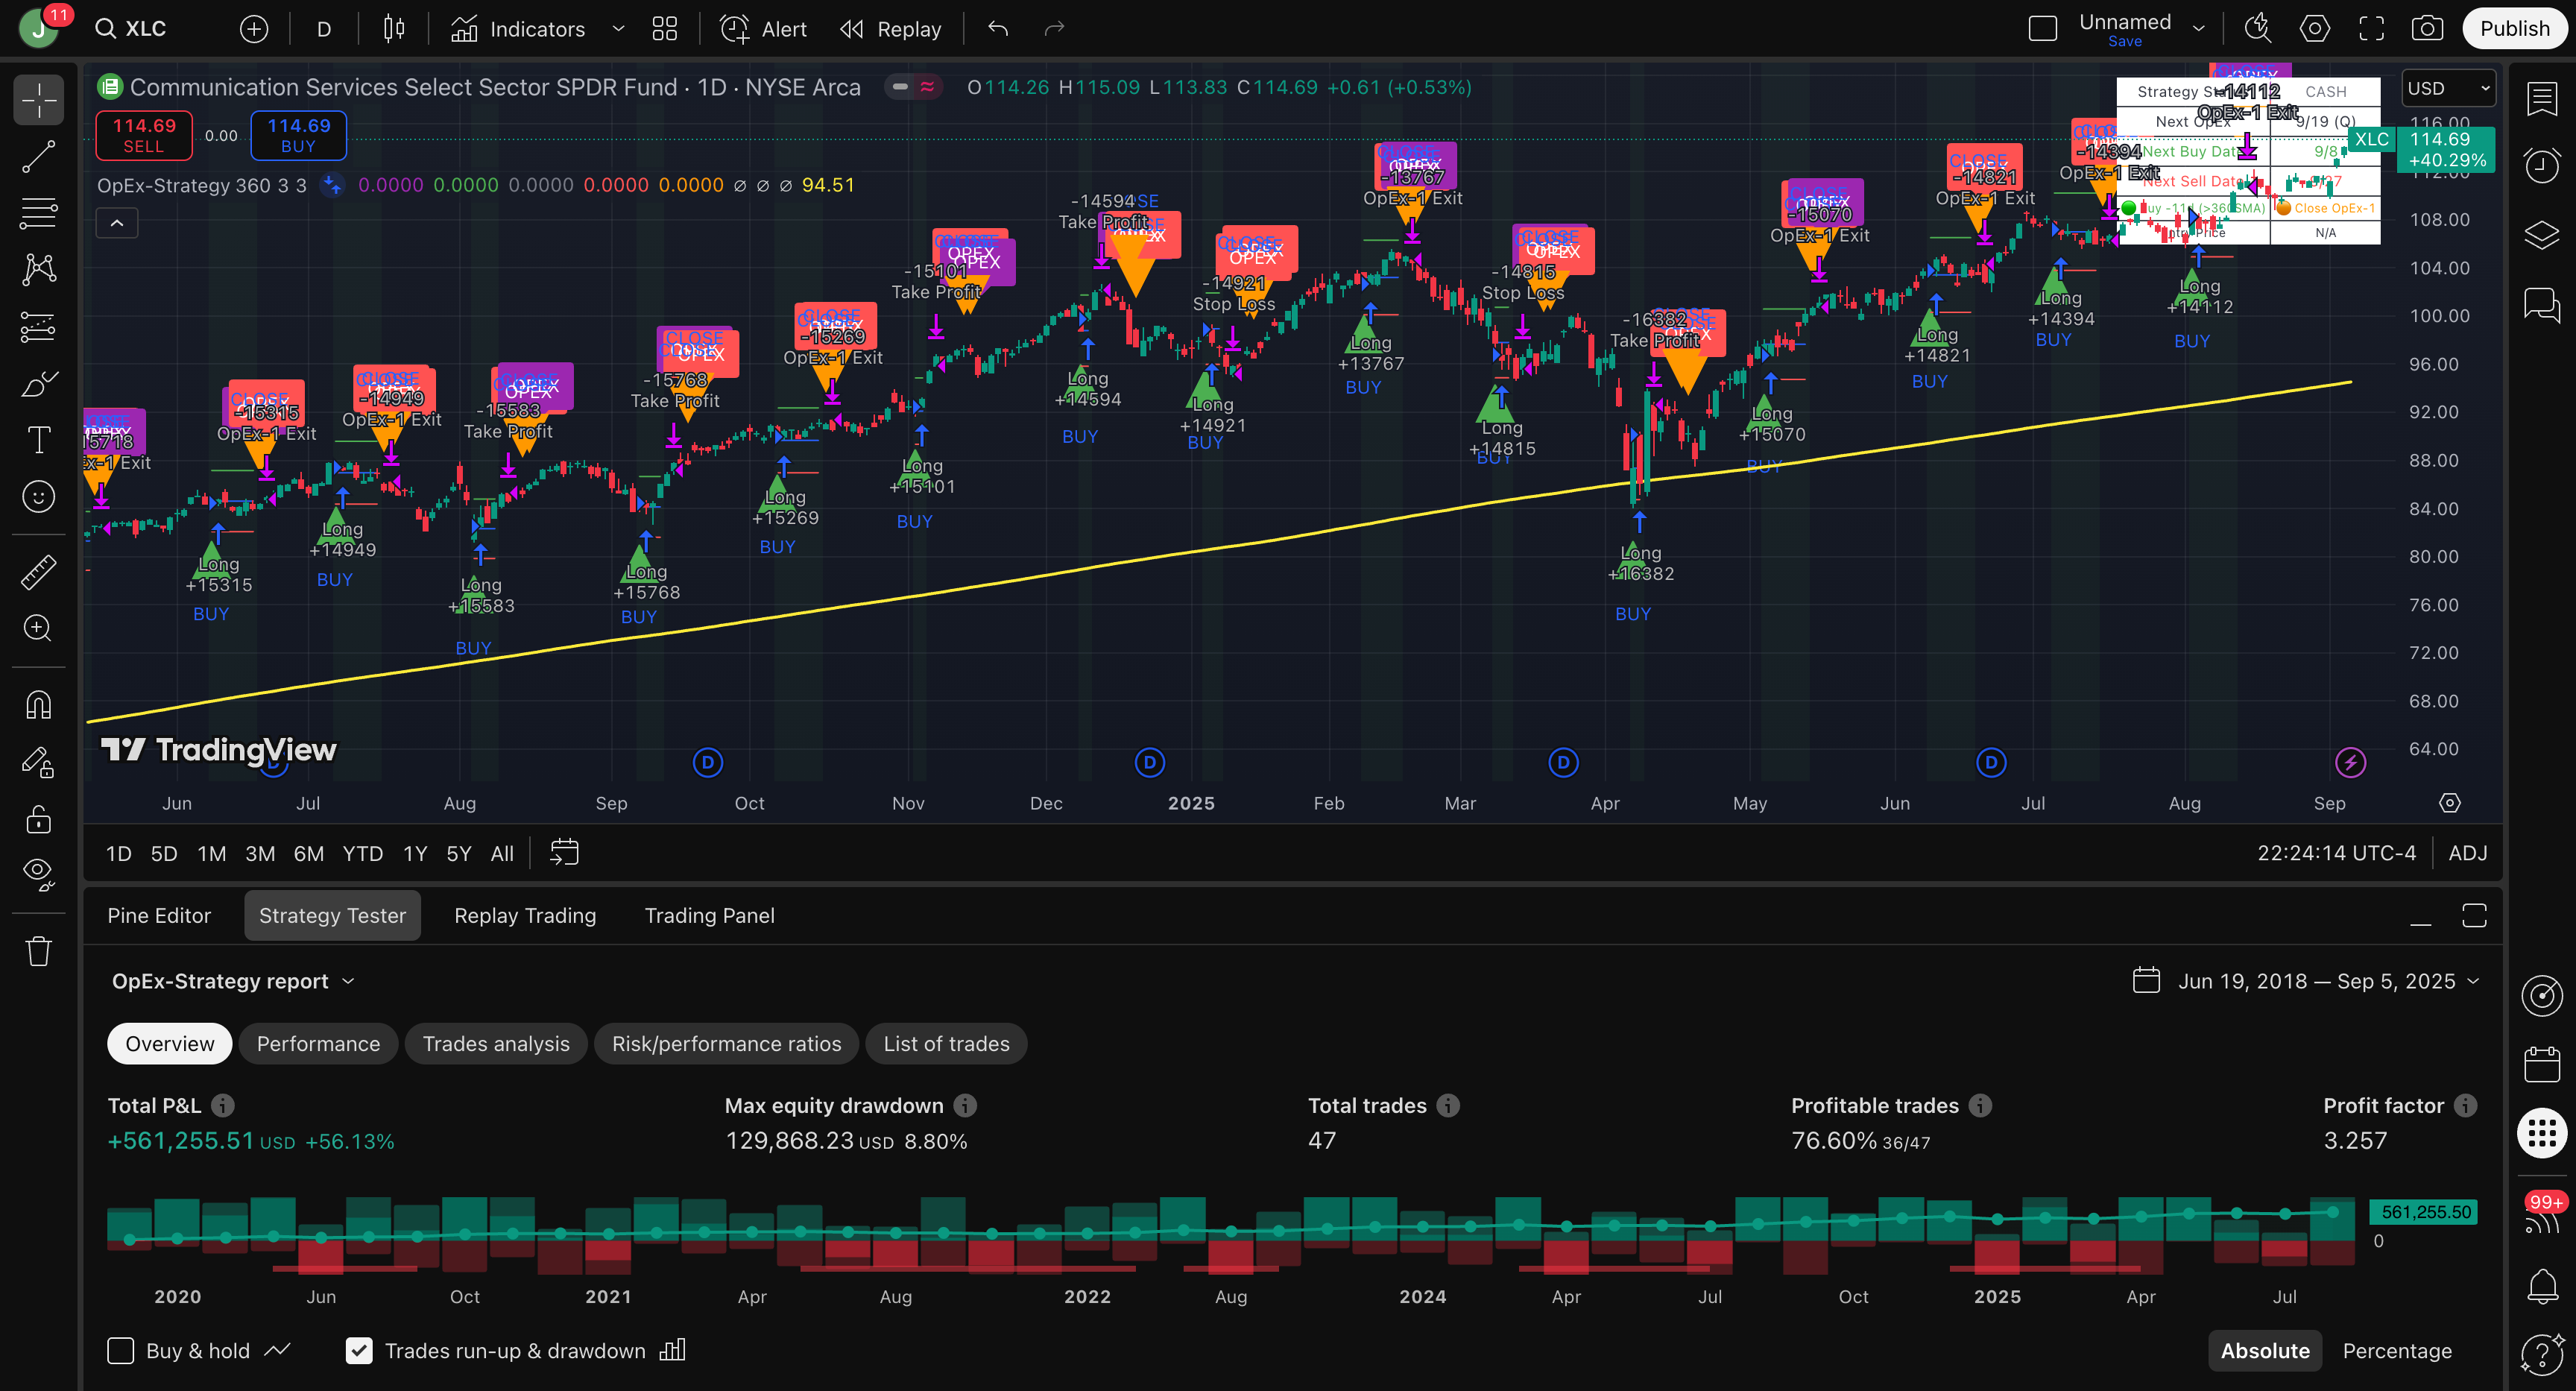
Bitcoin crashed 8% in two hours. Crypto Twitter exploded with panic. "Black swan!" they screamed. "Market manipulation!"
But our members weren't panicking. They were already positioned.
While everyone else got liquidated, our members either stayed out or profited from the crash. Then they bought the exact bottom when The Flow reversed.
This wasn't luck. This wasn't insider information. This was mathematical inevitability.
Our signals don't fire daily because we're not running a gambling service. They fire when $47 billion in forced transactions creates mathematical certainties. September 12th was one of those days.
January 17th will be another. But this time, the numbers are three times larger.
Trade where the market must go, not where it merely might.
Vanna-Charm Flows decode the structural forces that push price: the real-time hedging adjustments market makers are obligated to make as options near expiration or volatility shifts. When those obligations change, flows change. When flows change, price follows.
Most indicators watch price and hope to predict behavior. The Flow watches obligations and anticipates reactions.
By tracking the relationship between vanna (how volatility shifts change delta) and charm (how time decay changes delta), we surface the feedback loops that force dealers to buy or sell underlying—often before it shows up in price.
This isn't sentiment. It's structure. Options positioning → hedging rules → directional pressure.
Grounded in mechanics, not patterns. When dealers' deltas drift, they must rebalance. That rebalance is flow.
Timely by design. Approaching expirations and vol shocks accelerate hedge adjustments—creating predictable pressure.
Aligned with scale. We read flows tied to billions in notional positioning so you're not trading against a firehose; you're surfing it.
Vanna: If implied volatility moves, how much does the dealer's delta change? (Vol pop → dealer may need to buy/sell to stay hedged.)
Charm: As time passes, how much does the dealer's delta change? (Decay alone can force steady buying or selling.)
Vanna-Charm Flows: The net push those changes exert on the underlying—before price reveals it.
Right now, as you read this, Wall Street is building the most explosive options position in years.
January 17th marks the monthly options expiration. But this isn't just any expiration. This is when quarterly and monthly expirations collide.
Here's what that means in plain English:
Our models are flagging the most significant setup since March 2024. That window delivered +34% in 19 days for positioned members. Not through daily gambling, but through one high-conviction positioning opportunity.
This January window could be even more significant. But it requires the patience to wait for mathematical certainty, not the urge to trade every market wiggle.
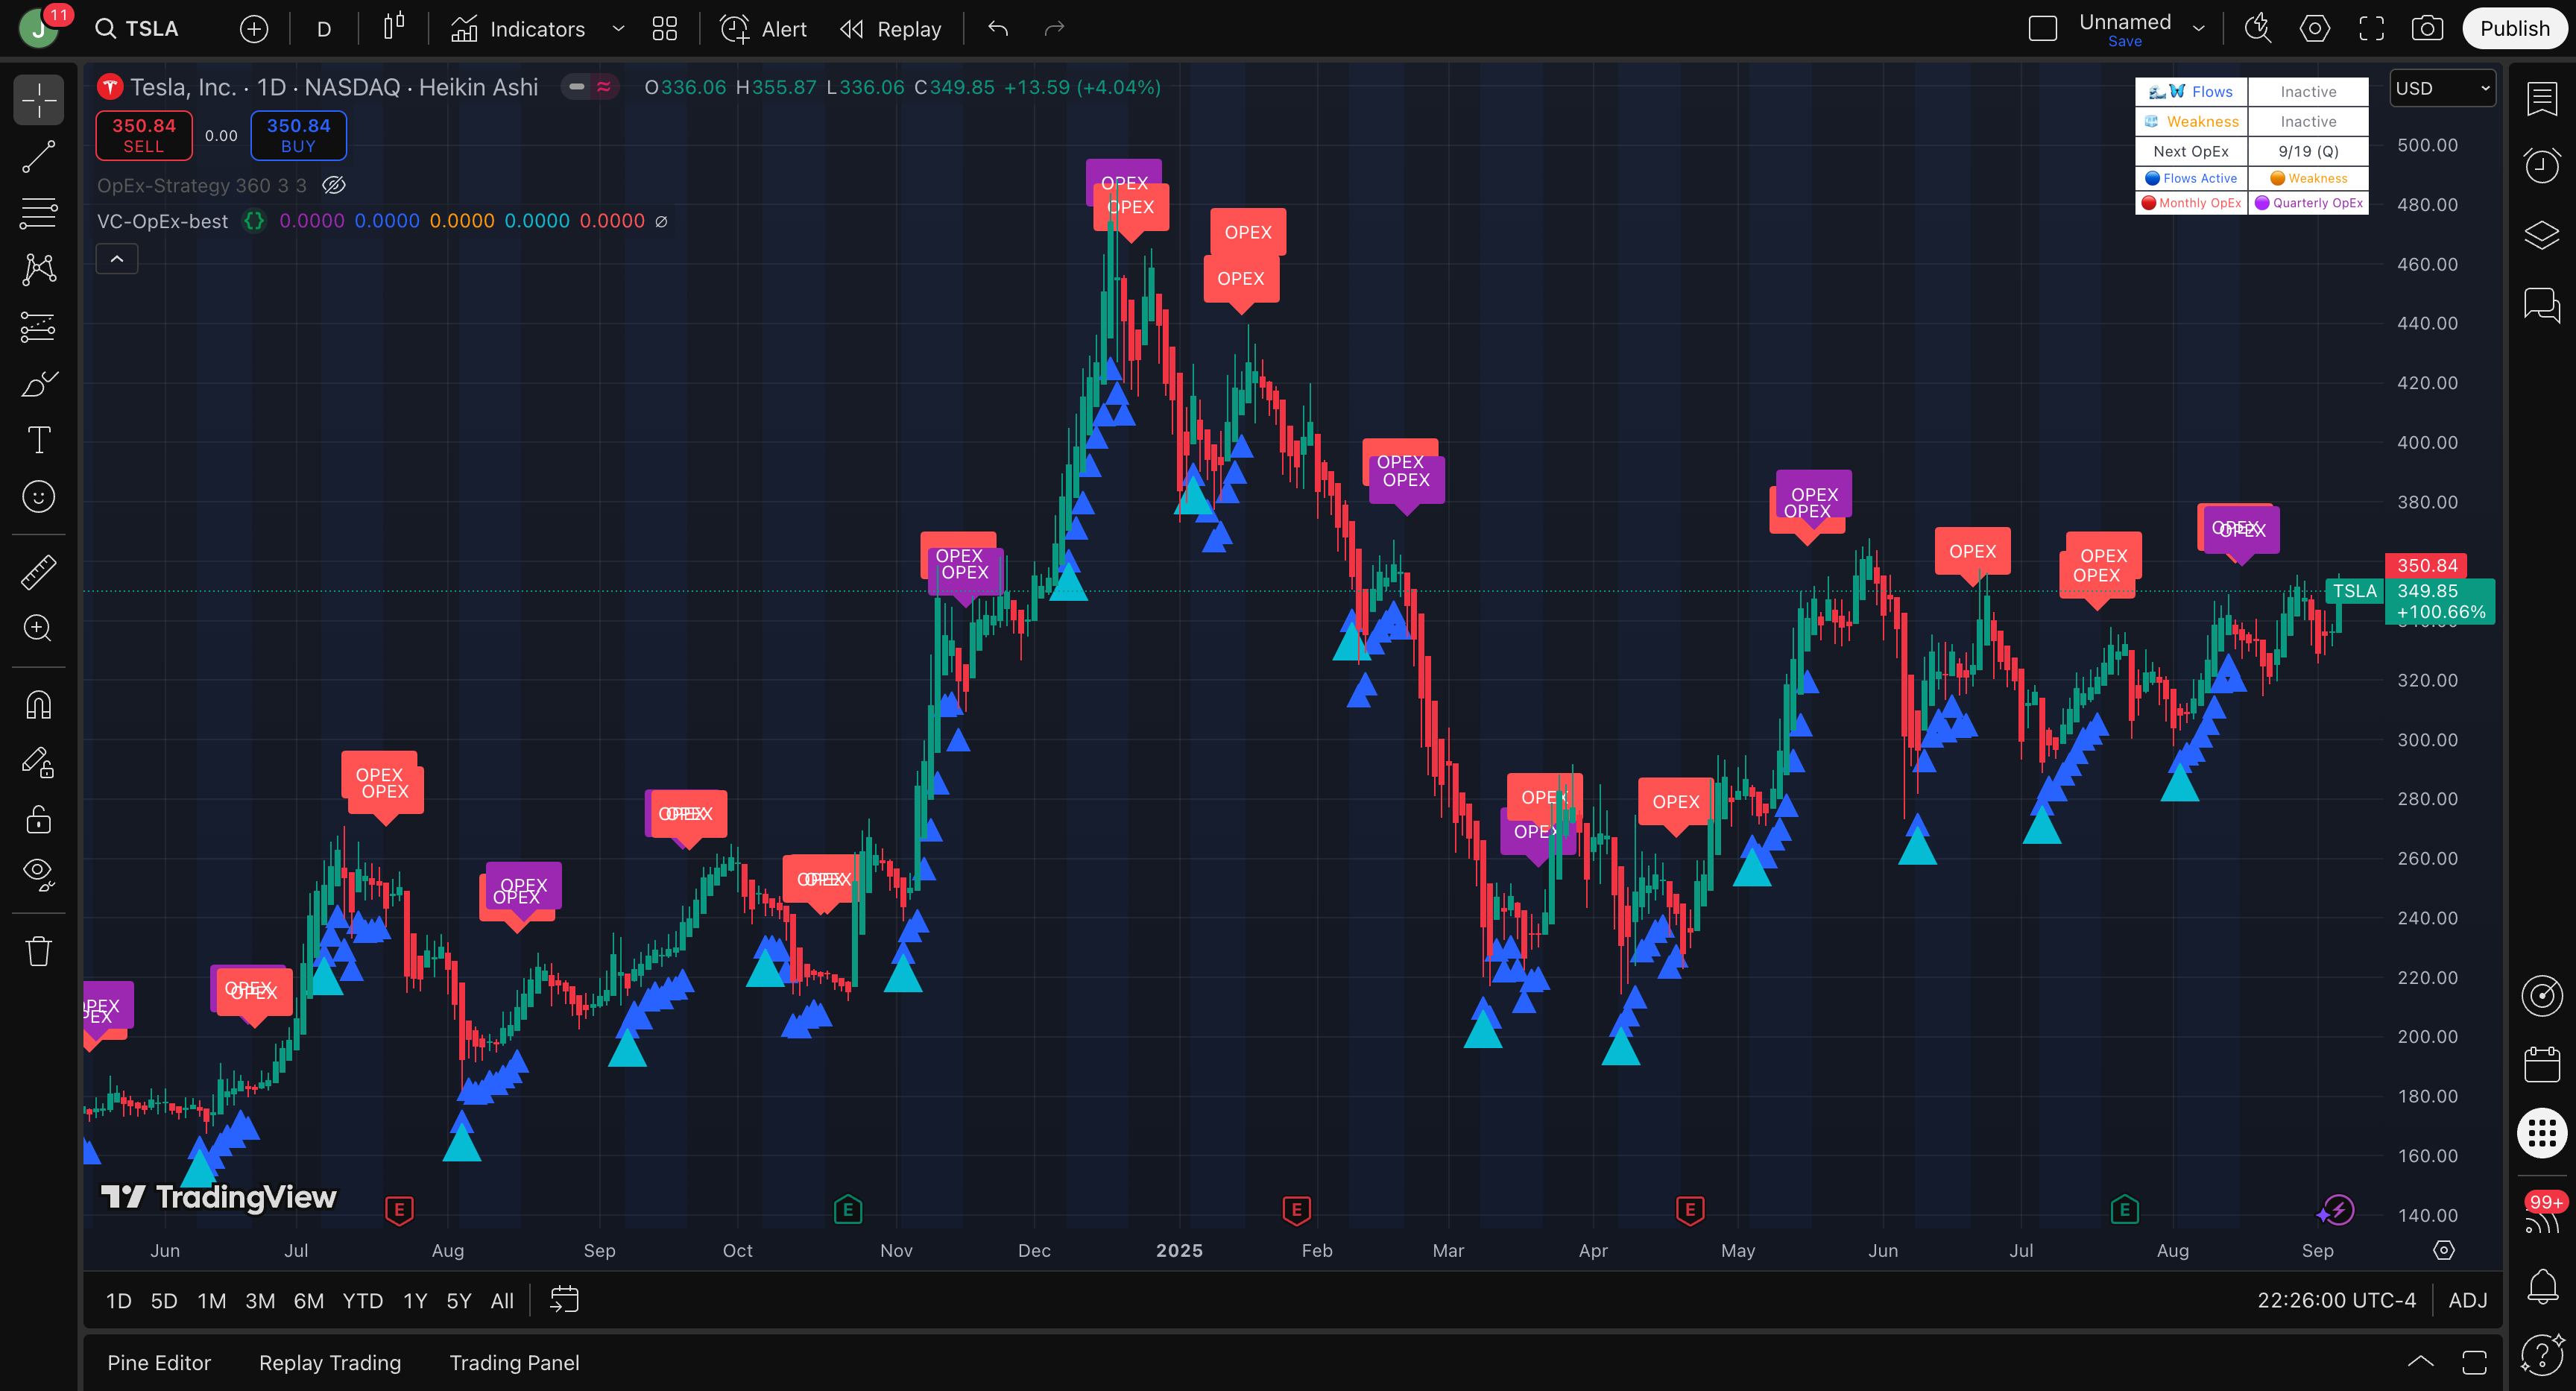
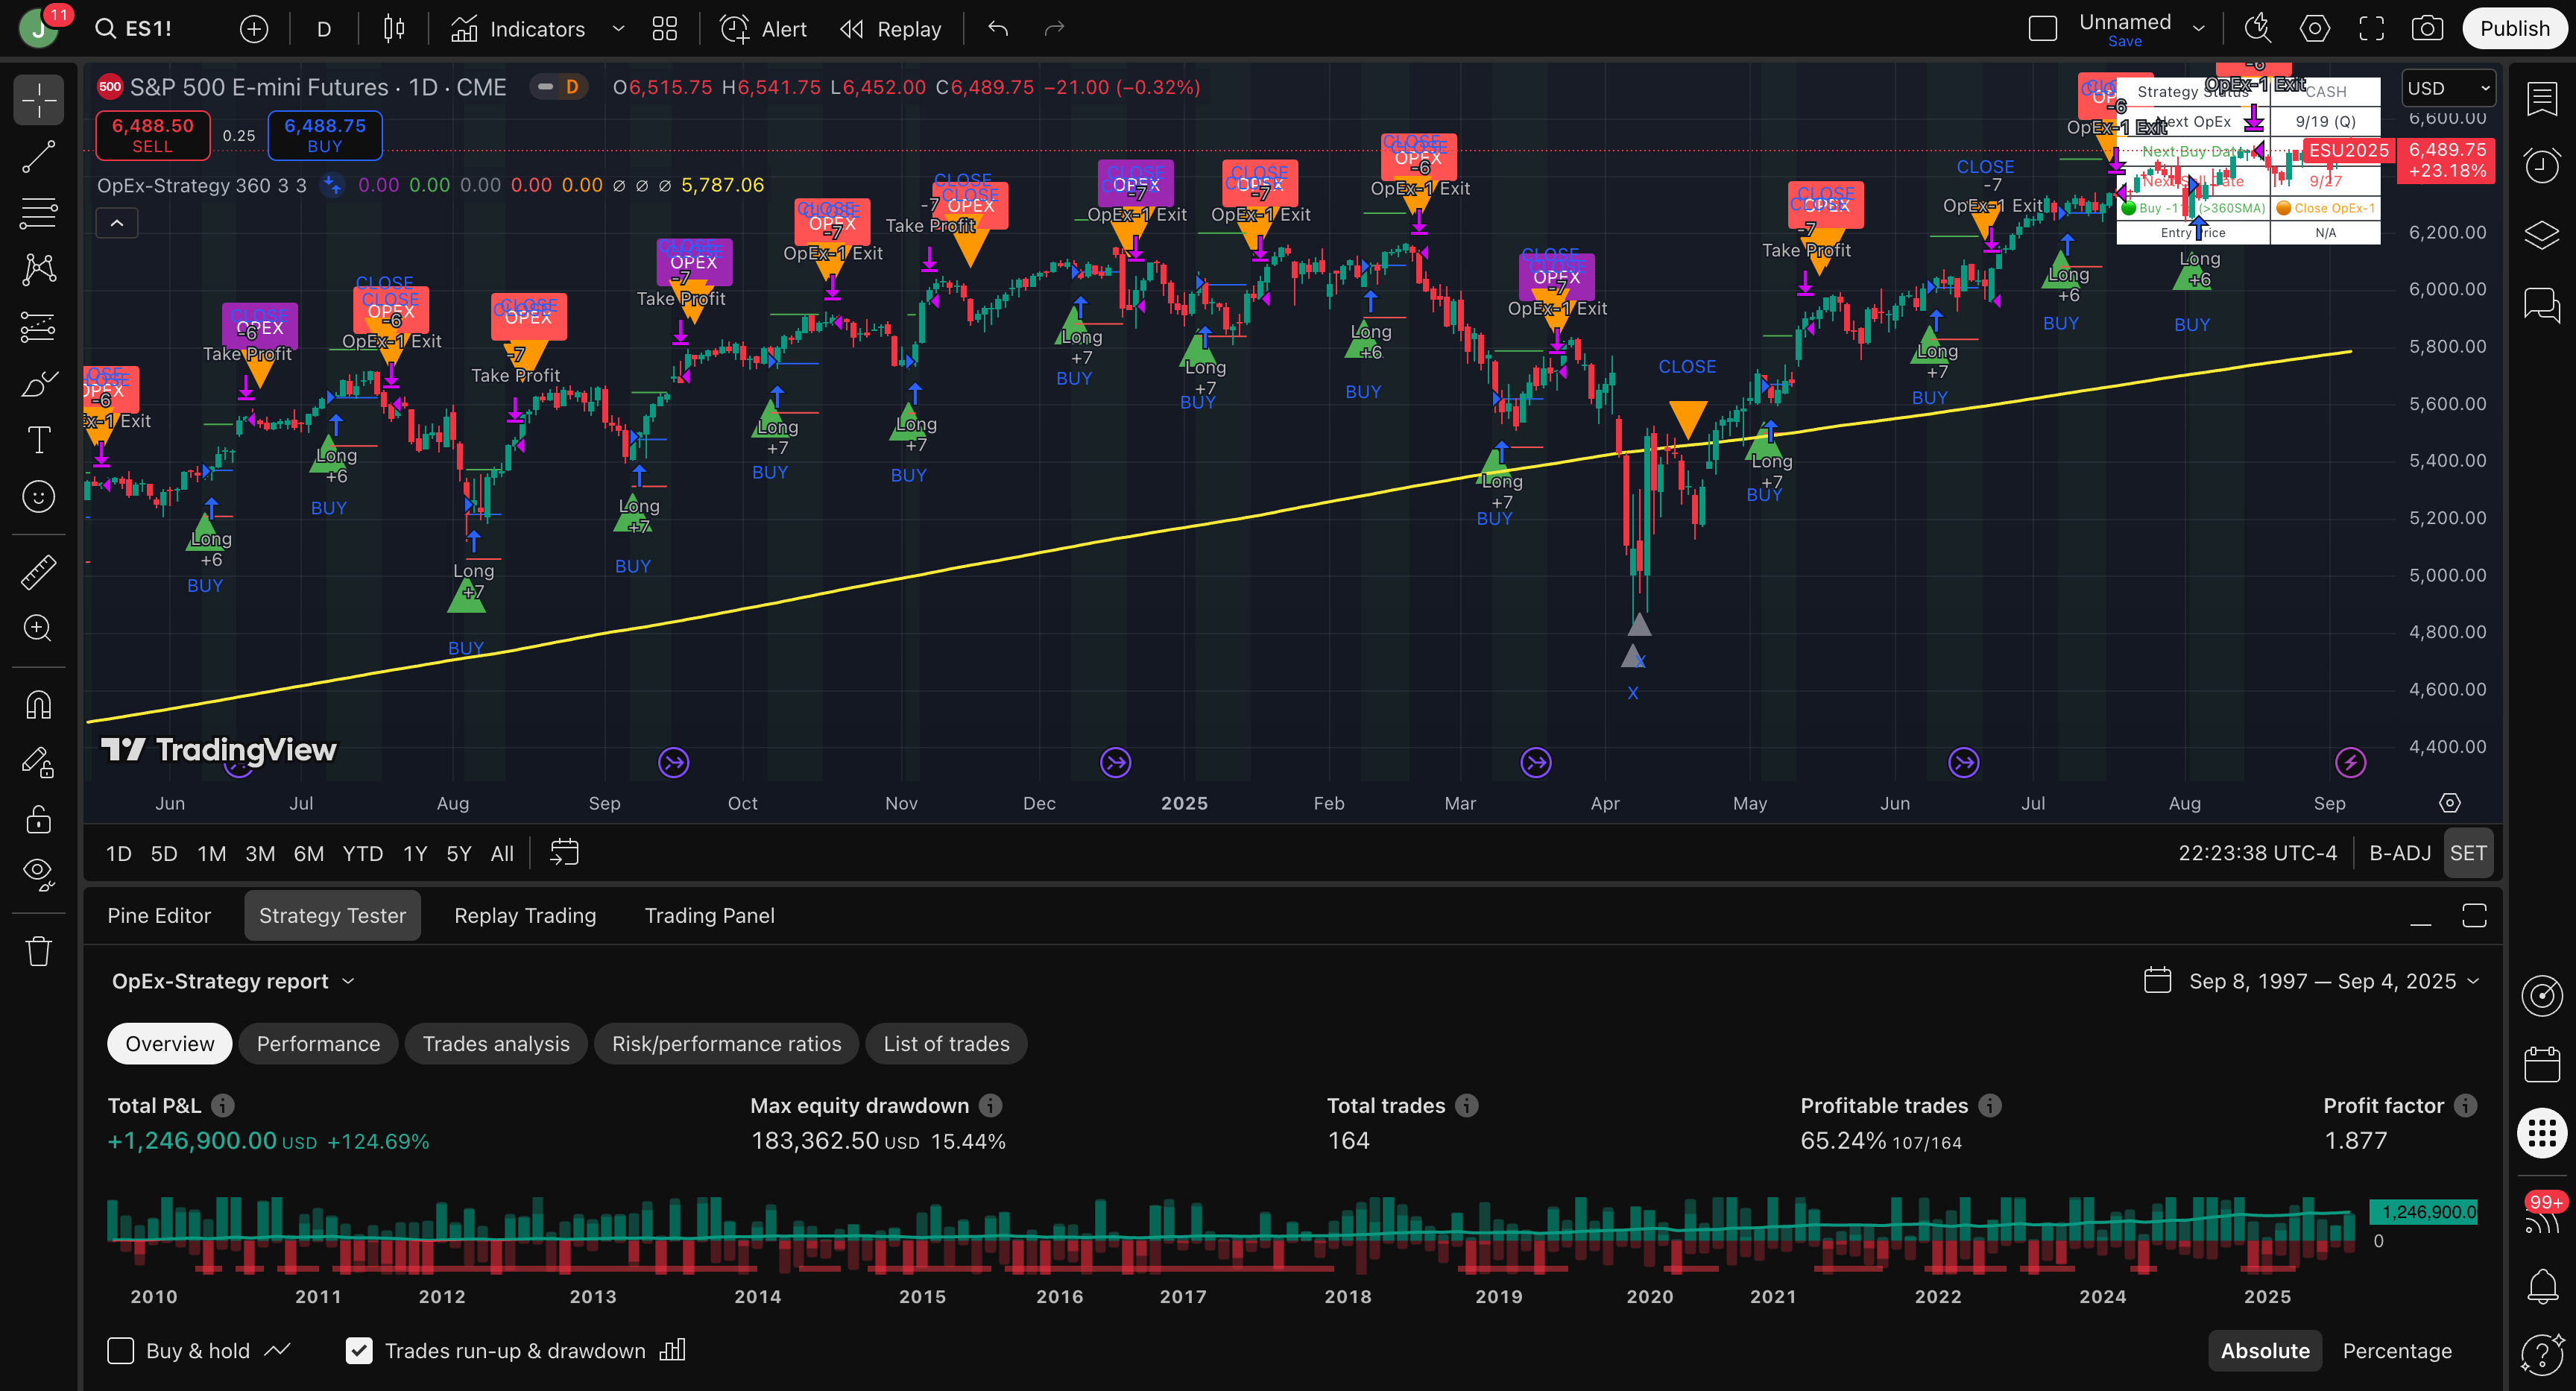
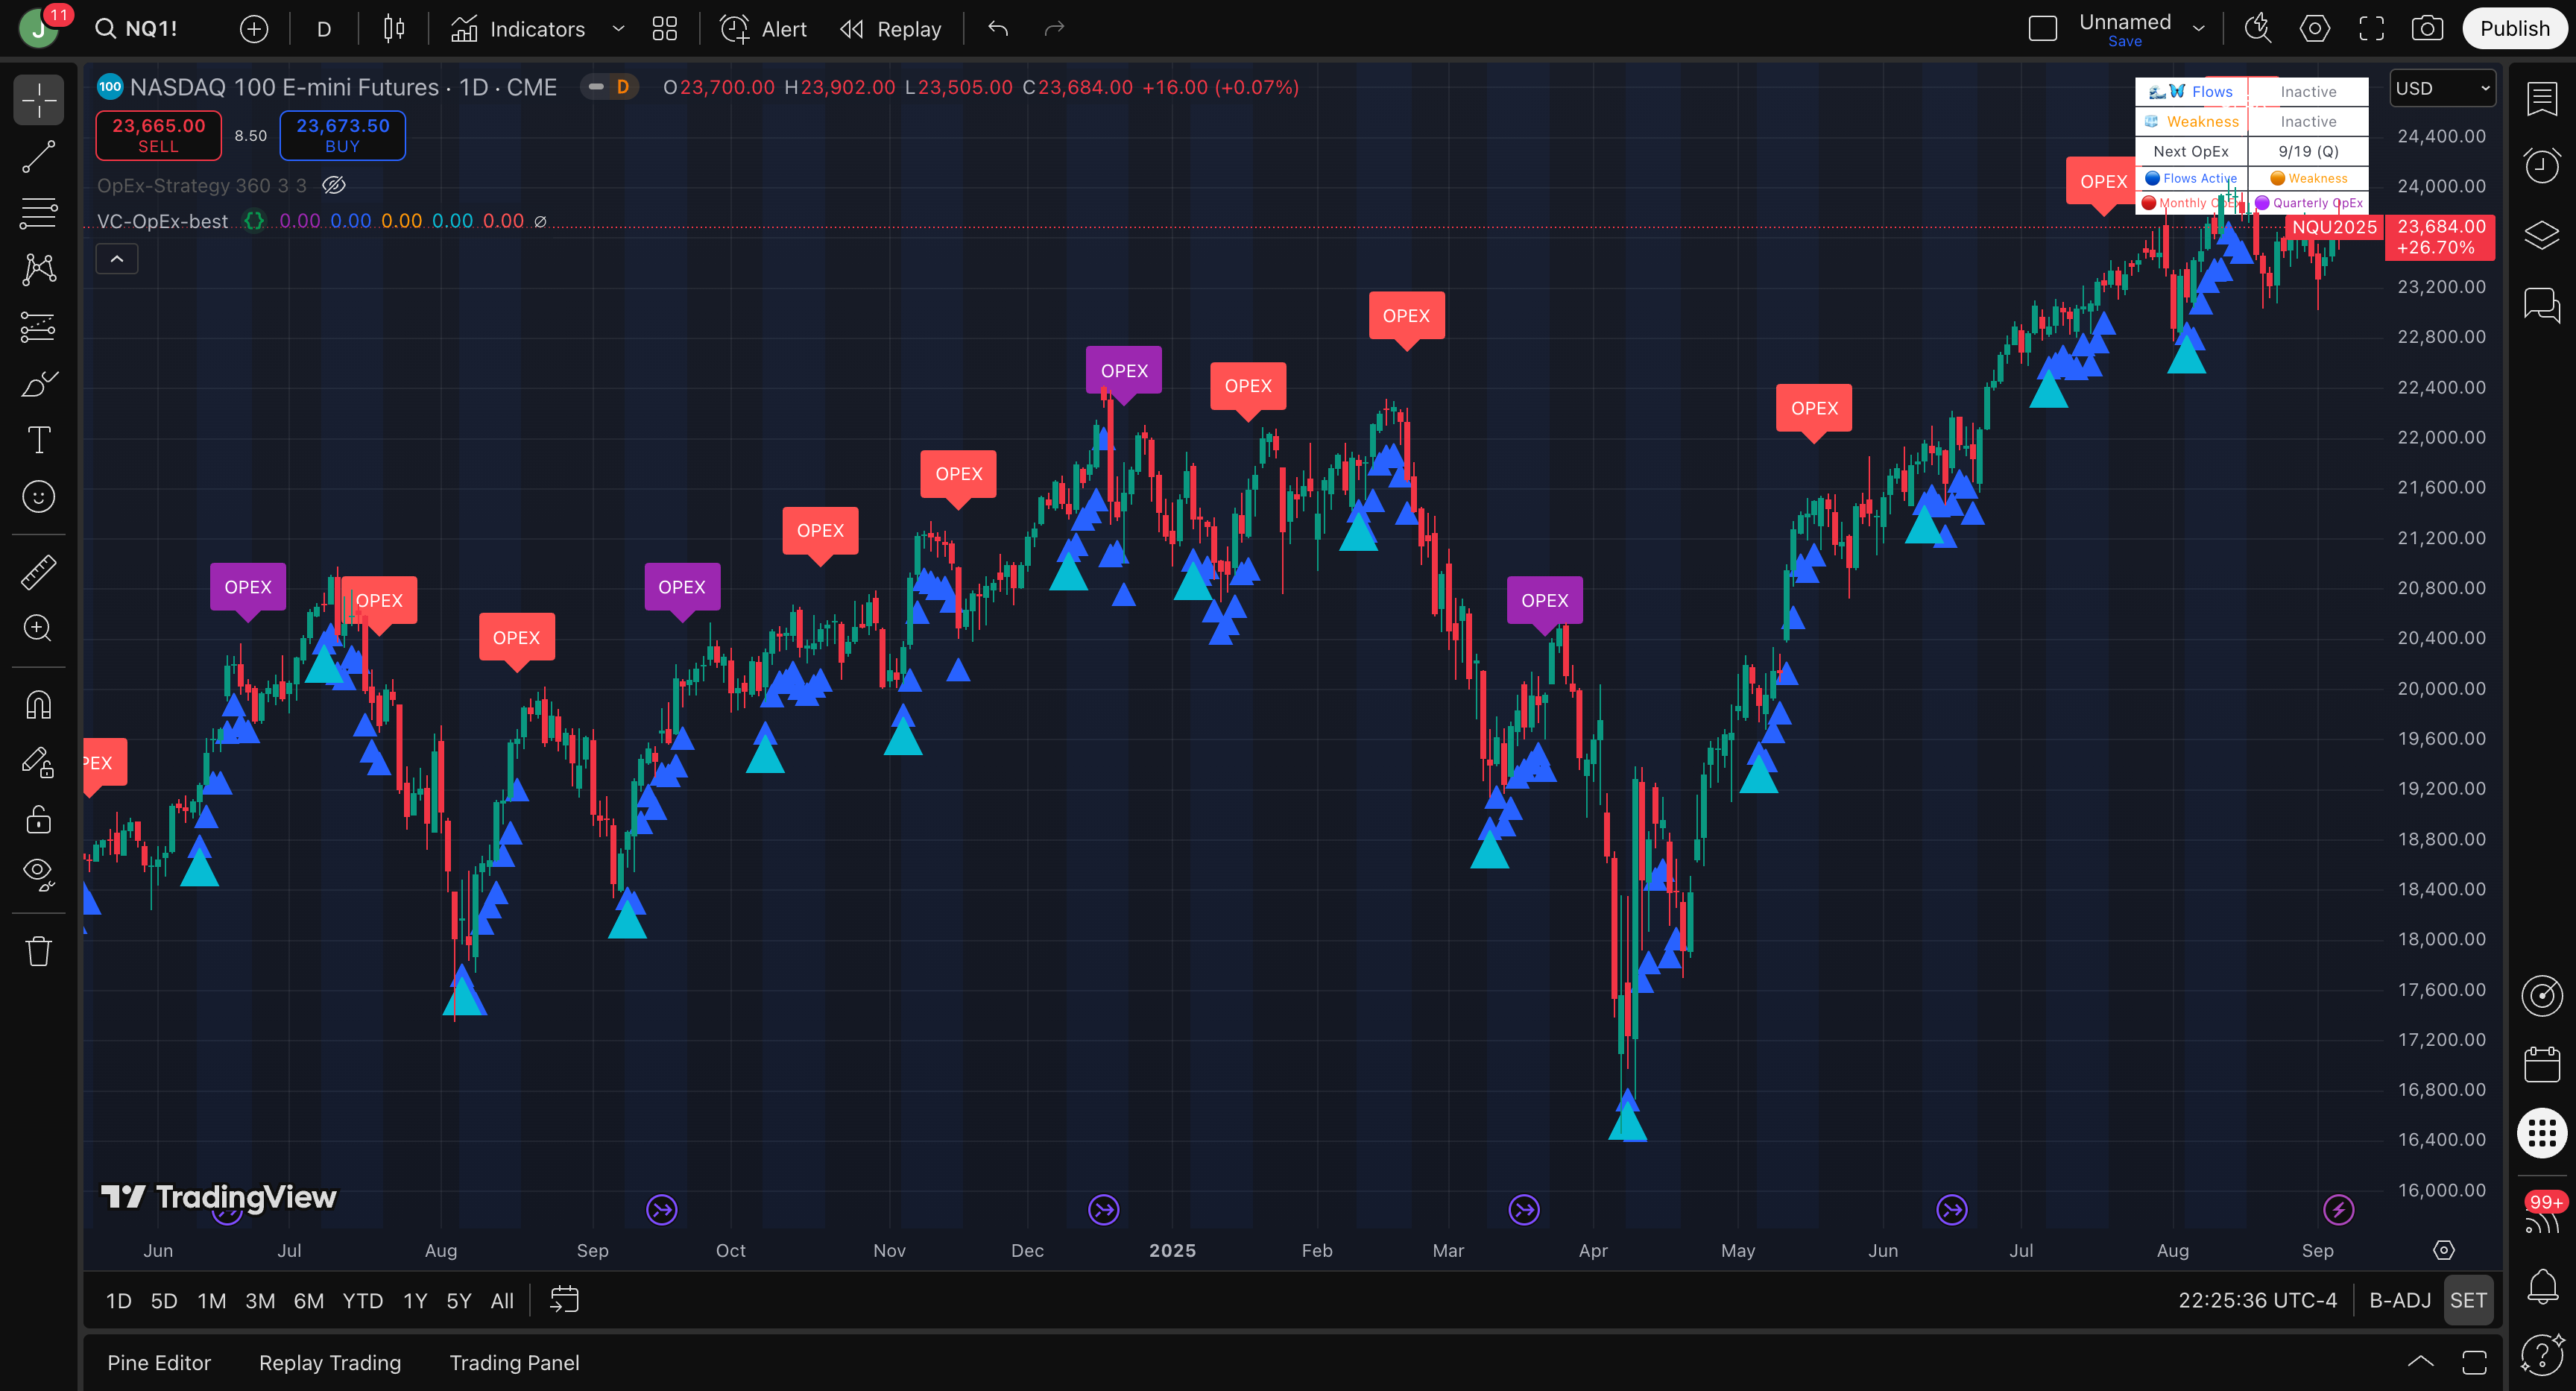
While you were fighting the market with outdated indicators, our members were positioned for these moves:
Let's do the math. If you had $100,000 to trade, you missed $47,000 in Q4 alone.
But here's the gut punch: It's not just the money you didn't make. It's the compounding effect. That $47,000 would have been available for the January window. Now it's not.
Stop giving the market charity. Start taking what's yours.
Here's the brutal truth about our capacity limits:
When everyone has the same information at the same time, the edge disappears. If we let in too many traders, we'd all be fighting over the same tiny windows. Nobody wins.
"I waited too long in July thinking I could join anytime. Door slammed shut. Watched our August and September calls play out perfectly from the sidelines. Cost me $30K easy. Never making that mistake again."
— Marcus T., Hong Kong
We'd rather have 2,500 profitable members than 25,000 broke ones fighting over scraps.
"Pre-VannaCharmAlgo I was playing checkers against 3D chess. Now I trade the source code."
Common thread: They acted.
Results vary with sizing and execution, but the common thread is consistent: members act inside clearly defined windows instead of reacting to noise.
Think about all the bad trades you made this year. Not because you lacked analysis, but because you were fighting forces you couldn't see.
How much did that ignorance cost you?
We're not here to feed your trading addiction with daily signals. We're here to give you high-conviction, mathematical opportunities when they actually exist.
Stop throwing money at the market. Start investing when the math is on your side.
Each component reduces ambiguity at decision time—what's the bias, when is the window, and how to structure around it. Strategy further removes hesitation with complete entries/exits.

Backtests inform regime expectancy; execution, sizing, and volatility of the period affect realized outcomes. Historical profits are not guarantees.
Translation: The next 4–6 weeks can define your year's P&L. Requirement: Be in before Jan 15.
Translation: The next 4–6 weeks can define your year's P&L. Requirement: Be in before Jan 15. Chasing post-move = someone else's exit.
Looking for gambling excitement? Check out DraftKings or Vegas. Our signals fire when $47 billion in forced flows demand it, not when you're bored.
If you want purposeful, high-conviction opportunities based on institutional math, you'll fit right in.
If you do not see a profitable, actionable signal within your first 48 days, we refund 100% of your first month's pro‑rata fee (based on the plan you choose). You keep your onboarding materials.
Simple terms:
Turn alerts on. Watch windows develop. Make an informed decision. If you don't see actionable edge in the first 48 days, we pay you 100% of the pro-rata month.
Indicator ($99/mo): TradingView overlay + alerts. Strategy ($399/mo): Includes Indicator plus complete entries/exits and position management prompts with real-time delivery.
Yes. You can upgrade any time; your next billing cycle will reflect the Strategy plan.
Many traders treat it as an education/data expense. Consult your tax professional.
Absolutely not. Our signals are purposeful and periodic, not constant. You might go weeks between high-conviction setups. This isn't day-trading entertainment—it's mathematical positioning when the odds are overwhelmingly in your favor.
The 48-day 100% guarantee applies as stated. Monthly subscriptions are otherwise non-refundable.
Have a question that isn't covered here? Reach out after checkout—priority support is included in your plan.
Option 1: You close this page. Keep trading with the same indicators everyone else uses. Watch the market move against you "for no reason." Wonder why your account keeps shrinking.
Option 2: You join 2,453 traders who see what's coming before it happens. You stop being surprised by market moves and start profiting from them.
The January window opens in .
You can be positioned for the biggest Flow event of 2025. Or you can watch it happen to you instead of for you.
The dealers will hedge their $47 billion whether you're ready or not.
The only question is: Will you be riding the wave or getting crushed by it?
Risk Disclosure: Trading involves a substantial risk of loss and is not suitable for all investors. Past performance is not indicative of future results. You are solely responsible for your trading decisions.